The JOST Werke SE is listed on the regulated market (Prime Standard) of the Frankfurt Stock Exchange.
-
 English
-
 Deutsch
|
Corporate
|
About us
|
Investors
|
Suppliers
|
Sustainability
|
News & Media

Investor Relations
Our Stock
JOST Werke SE is listed on the regulated market (Prime Standard) of the Frankfurt Stock Exchange.
JST
Symbol
DE000JST4000
ISIN
Frankfurt
Exchange
SDAX
Index
Basic Information
Key share data and listing information for JOST Werke SE.
| Issuer | JOST Werke SE |
| Issued Shares | 16,390,000 |
| Share Capital | €16,390,000 |
| Isin | DE000JST4000 |
| Wkn | JST400 |
| Trading Symbol | JST |
| Ticker Bloomberg | JST GY |
| Exchange | Frankfurt Stock Exchange, XETRA |
| Market Segment | Regulated Market (Prime Standard) |
| Share Type | Ordinary bearer shares |
| First Trading Day | 20 July 2017 |
| Issue Price | €27.00 |
| Index Affiliation | PRIME ALL, CDAX, SDAX |
| Accounting Standard | IFRS |
| Fiscal Year End | 31 December |
| Industry | Automotive, commercial vehicle supplier |
| Designated Sponsors | ODDO BHF, Baader Bank |
Shareholder structure of JOST Werke SE
as of December 10, 2025
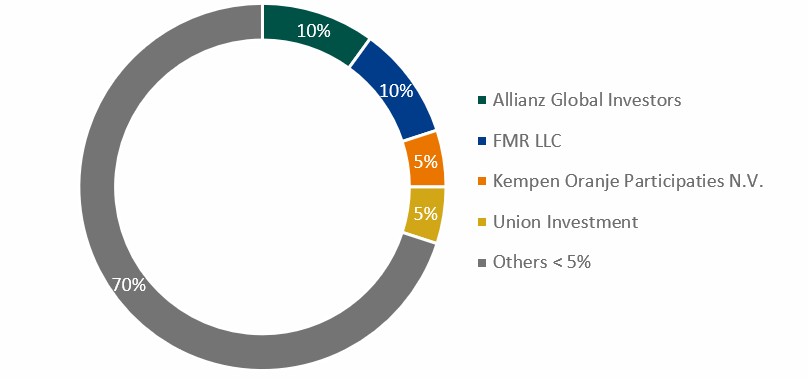
The registered share capital of JOST Werke SE amounts to €16,390,000. It is divided into the same number of no-par bearer shares with a nominal value of €1.00.
According to the definition of Deutsche Börse, the free float of JOST Werke SE amounted to 100 %. All voting rights notifications regarding JOST Werke SE can be found here.
Analysts' coverage
JOST Werke SE is covered by various financial analysts who publish research reports and earnings estimates.
13 May 2026
Berenberg
Yasmin Steilen
Price
€82.00
13 May 2026
Deutsche Bank
Nicolai Kempf
Price
€76.00
13 May 2026
ODDO BHF
Klaus Ringel
Price
€68.00
31 March 2026
M.M. Warburg
Fabio Hölscher
Price
€74.00
Disclaimer: JOST Werke SE is not involved in preparing the estimates. The estimates are based solely on research conducted by independent financial analysts. These analyses reflect only the opinions, assessments, forecasts, or recommendations of financial analysts regarding JOST’s performance and do not represent the opinion, assessment, forecast, or recommendation of JOST or its Management.
JOST Werke SE is covered by various financial analysts, who provide their own research analyses and earnings estimates in respect of the company. On this page we provide you with the analyst estimates compiled by Vara Research GmbH. JOST Werke is neither involved in the collection of the information nor in the compilation of the estimates.
JOST Werke merely reproduces the consensus data compiled by Vara Research GmbH as a non-binding information for visitors of its website. This does not imply that the company endorses, concurs with or adopts such information, conclusions or recommendations. The estimates are based solely on analyses by independent financial analysts. JOST Werke SE assumes no liability for the accuracy of such estimates and undertakes no obligation to update or revise such estimates, even if they differ from our own forecasts or expectations.
| Q1 2025 A | FY 2025 A | Q1 2026 E | FY 2026 E | FY 2027 E | FY 2028 E | |
|---|---|---|---|---|---|---|
| Sales (in m EUR) | ||||||
| - Number of estimates | 3 | 3 | 3 | 3 | ||
| - Highest | 400.0 | 1,649.6 | 1,757.5 | 1,814.4 | ||
| - Consensus | 373.7 | 1,534.2 | 397.2 | 1,618.4 | 1,721.7 | 1,772.0 |
| - Median | 399.5 | 1,614.2 | 1,708.4 | 1,759.7 | ||
| - Lowest | 392.1 | 1,591.5 | 1,699.1 | 1,741.9 | ||
| Adj. EBITDA (in m EUR) | ||||||
| - Number of estimates | 3 | 3 | 3 | 3 | ||
| - Highest | 50.3 | 236.0 | 264.8 | 272.4 | ||
| - Consensus | 45.5 | 191.2 | 49.3 | 226.2 | 244.3 | 252.9 |
| - Median | 49.4 | 234.0 | 235.7 | 244.0 | ||
| - Lowest | 48.5 | 208.6 | 232.3 | 242.2 | ||
| Adj. EBITDA margin (in %) | ||||||
| - Number of estimates | 3 | 3 | 3 | 3 | ||
| - Highest | 12.6 | 14.7 | 15.1 | 15.0 | ||
| - Consensus | 12.2 | 12.5 | 12.4 | 14.0 | 14.2 | 14.3 |
| - Median | 12.4 | 14.3 | 13.9 | 14.0 | ||
| - Lowest | 12.3 | 12.9 | 13.6 | 13.8 | ||
| Adj. EBIT (in m EUR) | ||||||
| - Number of estimates | 3 | 3 | 3 | 3 | ||
| - Highest | 40.8 | 163.4 | 184.9 | 192.6 | ||
| - Consensus | 35.7 | 145.2 | 40.0 | 160.4 | 176.5 | 183.7 |
| - Median | 40.1 | 160.8 | 175.3 | 182.5 | ||
| - Lowest | 39.1 | 156.9 | 169.5 | 176.1 | ||
| Adj. EBIT margin (in %) | ||||||
| - Number of estimates | 3 | 3 | 3 | 3 | ||
| - Highest | 10.2 | 10.1 | 10.5 | 10.6 | ||
| - Consensus | 9.6 | 9.5 | 10.1 | 9.9 | 10.3 | 10.4 |
| - Median | 10.1 | 9.9 | 10.3 | 10.4 | ||
| - Lowest | 10.0 | 9.7 | 10.0 | 10.1 | ||
| Reported Net Income (in m EUR) | ||||||
| - Number of estimates | 2 | 3 | 3 | 3 | ||
| - Highest | 17.4 | 66.5 | 87.9 | 98.2 | ||
| - Consensus | 13.1 | 9.4 | 15.9 | 60.5 | 83.6 | 92.2 |
| - Median | 15.9 | 59.2 | 86.3 | 96.4 | ||
| - Lowest | 14.4 | 55.7 | 76.6 | 81.9 | ||
| EPS (in EUR) | ||||||
| - Number of estimates | 2 | 3 | 3 | 3 | ||
| - Highest | 1.12 | 4.30 | 5.69 | 6.35 | ||
| - Consensus | 0.88 | 0.55 | 1.03 | 3.84 | 5.31 | 5.86 |
| - Median | 1.03 | 3.61 | 5.58 | 6.24 | ||
| - Lowest | 0.93 | 3.60 | 4.67 | 5.00 | ||
| Adj. EPS (in EUR) | ||||||
| - Number of estimates | 0 | 3 | 3 | 3 | ||
| - High | - | 6.53 | 7.34 | 7.88 | ||
| - Consensus | 1.65 | 5.52 | - | 6.00 | 6.84 | 7.38 |
| - Median | - | 5.76 | 6.65 | 7.39 | ||
| - Lowest | - | 5.70 | 6.54 | 6.86 | ||
| DPS (in EUR) | ||||||
| - Number of estimates | - | 2 | 2 | 2 | ||
| - High | - | 1.80 | 1.95 | 2.05 | ||
| - Consensus | - | 1.50 | - | 1.65 | 1.81 | 1.95 |
| - Median | - | 1.65 | 1.81 | 1.95 | ||
| - Lowest | - | 1.50 | 1.66 | 1.85 | ||
Updated on: June 3rd, 2026
Stay Updated
Subscribe to our investor alerts and receive the latest news, reports, and announcements directly to your inbox.